Methods of Monitoring Glycemic Control
SMBG
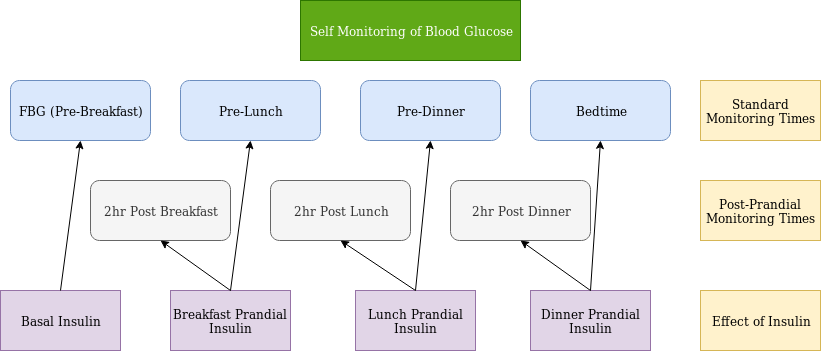
This involves checking Capillary Blood Glucose at set times of the day. A log is kept and brought to appointments to assist in managent of diabetes therapy. In patients with MDI (multiple daily injection) regimen, there are four primary times to check:
- Fasting Blood Glucose (FBG). This is usually before breakfast
- Pre-Lunch
- Pre-Dinner
- Bedtime
These checks help to inform adjustments of basal and prandial insulin (Figure 3).
- FBG informs basal insulin adjustment
- Pre Lunch informs breakfast prandial insulin adjustment
- Pre Dinner informs lunch prandial insulin adjustment
- Bedtime informs dinner prandial insulin adjustment
For example, if BG increases significantly between pre lunch and pre dinner checks, lunch prandial insulin may need to be adjusted
If pre-prandial checks are at goal, but A1c is still elevated, guidelines recommend post-prandial checks as post-prandial excursions may be responsible for persistently elevated A1c despite goal pre-prandial checks.
A1c
Hemoglobin A1c gives a 3 month estimate of glycemic control and is correlated to estimated Average Glucose (eAG) which can be derived by the A1c via the following calculator:
A1c Table
Continuous Glucose Monitor (CGM)
CGM technology records interstial blood glucose continuously throughout the day at set intervals (typically 5 minute intervals) and gives information about both glucose values and trends.
Why do these measures of glycemic control matter?
Each of these measures of glycemic control have been found to be associated with risk of microvascular complications of diabetes as is demonstrated in the following pages.
SMBG and A1C
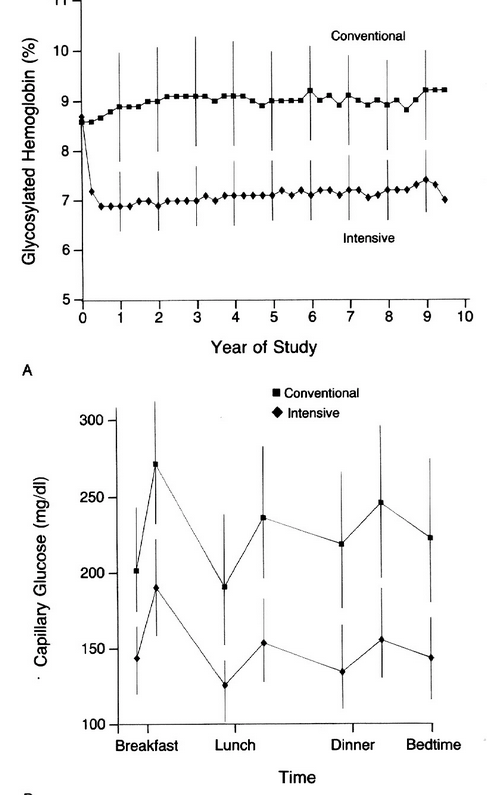
DCCT
https://www.ncbi.nlm.nih.gov/pubmed?term=8366922
Intensive vs conventional groups
Microvascular Complications between groups
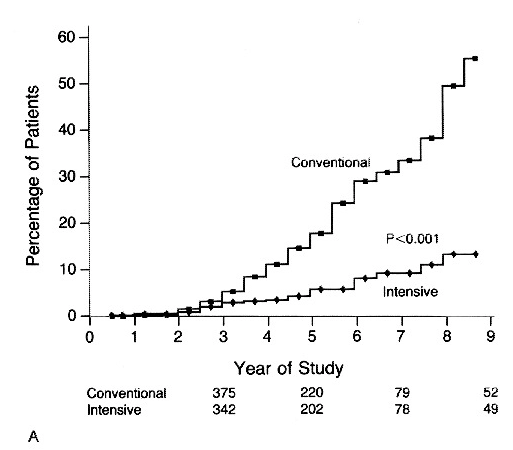
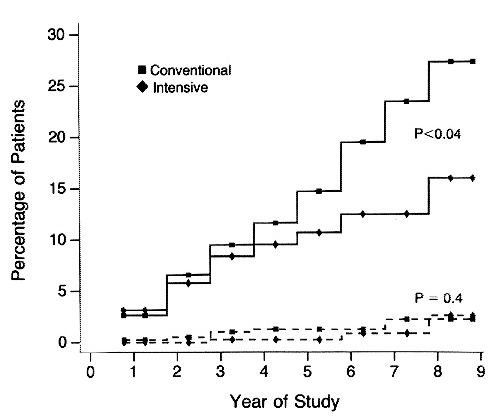
Retinopathy
Cumulative incidence of sustained change in retinopathy (change observed by fundus photography of at least three steps form basline, sustained for at least six months)
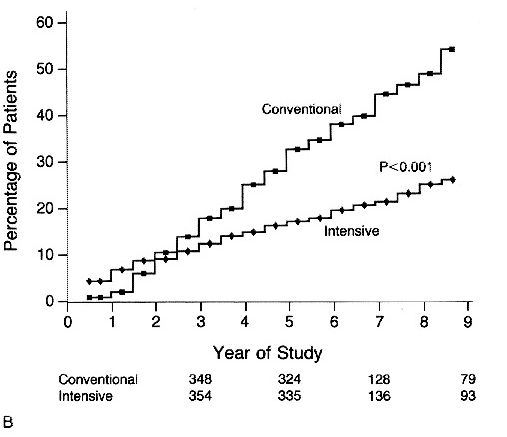
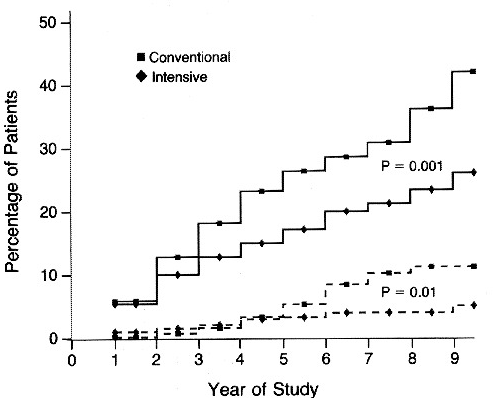
Nephropathy
Urinary Albumin Excretion >/= 300mg/24hrs (dashed line), >/=40mg per 24hrs (solid line) in patients with IDDM Receiveing Intensive or Conventional Therapy
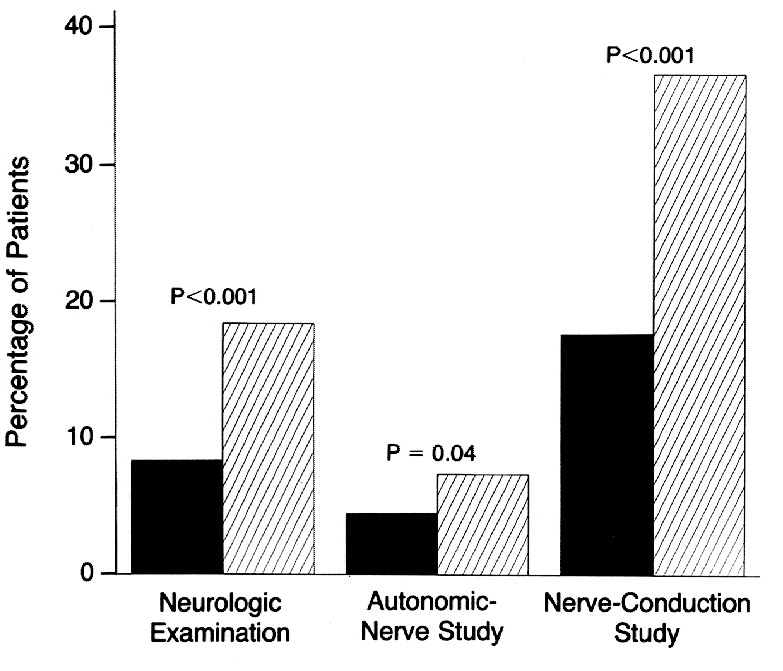
Neuropathy
CGM
Validation of Time in Range as an outcome Measure for Diabetes Clinical Trials
https://care.diabetesjournals.org/content/42/3/400
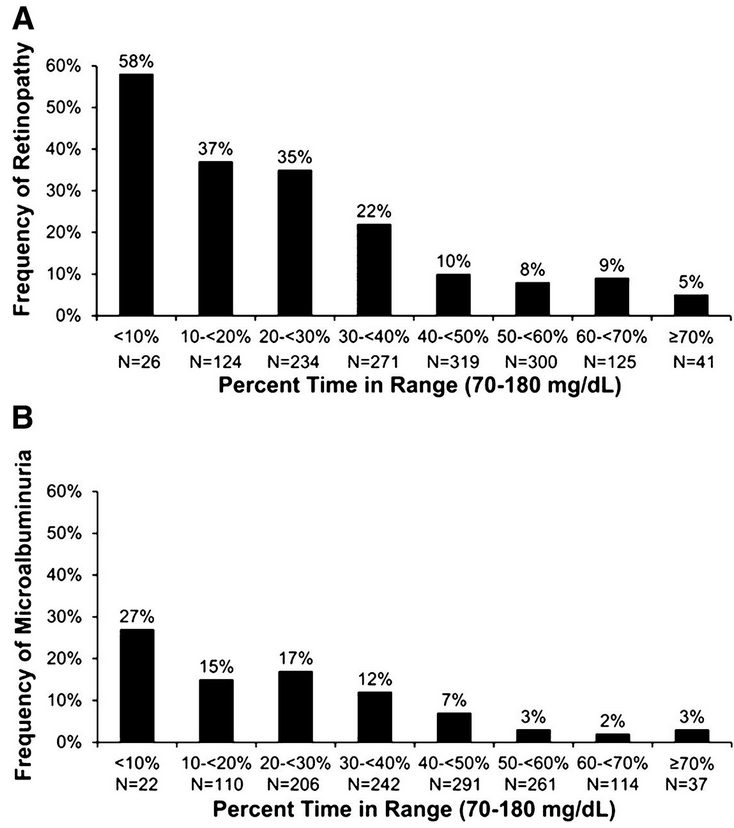
CGM vs A1c
The following example provides two separate scenarios of glucose trends which both equate to the same A1c (7%)
As can be seen, A1c does not give good information about hypoglycemia or hyperglycemia if there are large glycemic excursions. In scenario 1, the periods of hypoglycemia are balanced by the periods of hyperglycemia to equate to the same A1c as scenario 2. This additional information is very useful in adjusting therapy and for safety, as hypoglycemia is directly related to cardiac arrhythmias.
Glycemic goals
There are several different guidelines for glycemic goals for DM. Newer guidelines emphasize individualizing glycemic targets based on individual patient characteristics. The following is a summary of ADA guidelines for DM based on health status and age category:
For more information and definitions, see ADA guidelines:
Proposed CGM goals:
Where TIR=Time in Range, TAR=Time Above Range, TBR=Time Below
Range
These ranges are readily available from CGMs, and can be less accurately
(due to much less data) estimated from SMBG data or glucometers. The
following site can assist with estimating ranges and graphing trends
from SMBG data uploaded in excel format:
https://insulin.ddns.net/dm/log/